Simplify Analyzing Power Meter Information
How to Use Software for Analyzing Power Meter Data
Analyze power meter data to transform your training. The right software provides valuable insights into your performance. This blog post guides you in using software for power meter data analysis. We’ll share tips, advice, and benefits of this powerful tool.
Understanding Power Meter Data
Power meters measure the force you apply while cycling. They deliver real-time data on your output in watts. Analyzing this information helps you identify strengths and weaknesses. Use this data to tailor your training plans effectively.
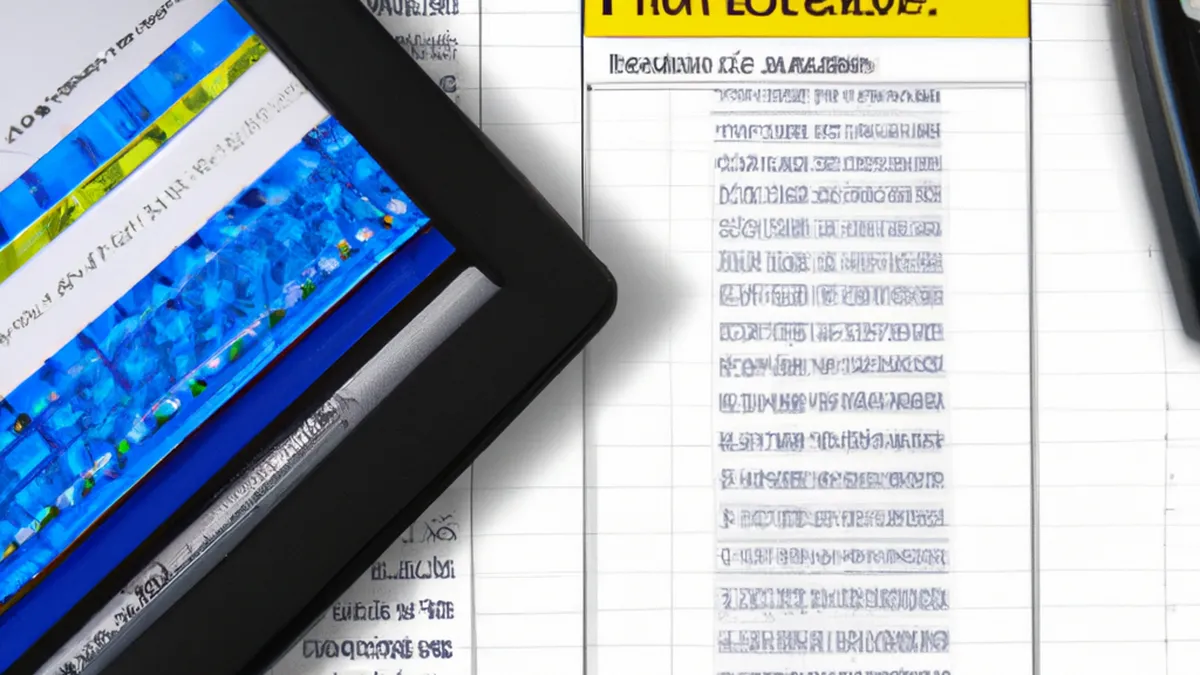
Power meter data includes metrics like average power, normalized power, and variance. These metrics show how hard you worked during a ride. With software, visualize this data and track your progress over time.
Choosing the Right Software
Not all software for analyzing power meter data works equally. Many options exist, so choose wisely. Here are a few popular choices:
1. TrainingPeaks
TrainingPeaks leads in tracking athletic performance. It provides detailed analytics and lets you create training plans. The software offers a free version and a premium option with advanced features.
2. Strava
Strava is popular among cyclists and runners. It has a user-friendly interface and robust analysis tools. While Strava is free, consider a premium subscription for advanced metrics.
3. Golden Cheetah
Golden Cheetah is a free, open-source software designed for cyclists. It offers extensive analysis options, including power analysis and training load calculations. This software appeals to serious cyclists.
Tips for Effective Data Analysis
After choosing your software, dive into your data. Here are some tips for effective power meter data analysis:
1. Set Clear Goals
Before analyzing data, set specific goals. Decide what you want to achieve from training. For example, do you wish to improve endurance or sprinting power? Clear goals will guide your analysis.
2. Regularly Upload Data
Consistency is vital for effective analysis. Regularly upload your power meter data to your chosen software. This habit helps you track progress over time and make necessary adjustments.
3. Utilize Visual Tools
Most software offers visual tools for understanding your data. Use graphs and charts to observe trends in your performance. Visual representations help you spot areas for improvement.
Best Practices for Analyzing Power Meter Data
Maximize the benefits of power meter data analysis by following these best practices:
1. Compare Different Rides
Comparing rides reveals patterns in your performance. Look for differences in power output across various terrains and conditions. This analysis identifies your strengths and weaknesses.
2. Monitor Your Training Load
Understanding your training load is crucial. It helps you gauge whether you’re overtraining or undertraining. Use the software to track your training load and adjust workouts accordingly.
3. Review Your Progress Regularly
Set aside time each week to review your power meter data. Regular reviews let you assess progress and make adjustments. This practice keeps you on track toward your goals.
4. Seek Feedback from Coaches
If you work with a coach, share your power meter data. Coaches provide valuable insights based on your data. They may suggest adjustments to your training plan, helping you reach your goals faster.
Benefits of Analyzing Power Meter Data
Analyzing power meter data offers numerous benefits. Here are some key advantages:
1. Improved Performance
Understanding your power output helps you make informed training decisions. This knowledge lets you push your limits and improve performance over time.
2. Enhanced Training Efficiency
Power meter data analysis helps you train smarter, not harder. Focus on specific areas needing improvement, making training more efficient.
3. Informed Recovery Strategies
Analyzing your data helps identify when to rest. Understanding your training load and performance metrics allows for effective recovery, reducing injury risk.
Conclusion
Using software to analyze power meter data is essential for serious cyclists. Choose the right software and follow best practices to unlock your full potential. Gain insights into your performance that help you train smarter and achieve your goals. Start using power meter data today, and watch your performance soar!
Below are related products based on this post:
FAQ
What are the key metrics provided by power meters that can be analyzed?
Power meters provide metrics such as average power, normalized power, and variance. These metrics indicate how hard you worked during a ride and help you identify strengths and weaknesses in your performance.
Which software options are recommended for analyzing power meter data?
Popular software options for analyzing power meter data include TrainingPeaks, which offers detailed analytics and training plans; Strava, known for its user-friendly interface and robust analysis tools; and Golden Cheetah, a free open-source software designed for extensive power analysis and training load calculations.
How can I make the most of my power meter data analysis?
To maximize your power meter data analysis, set clear training goals, regularly upload your data, utilize visual tools to observe trends, compare different rides, monitor your training load, review your progress weekly, and seek feedback from coaches for additional insights.


Post Comment