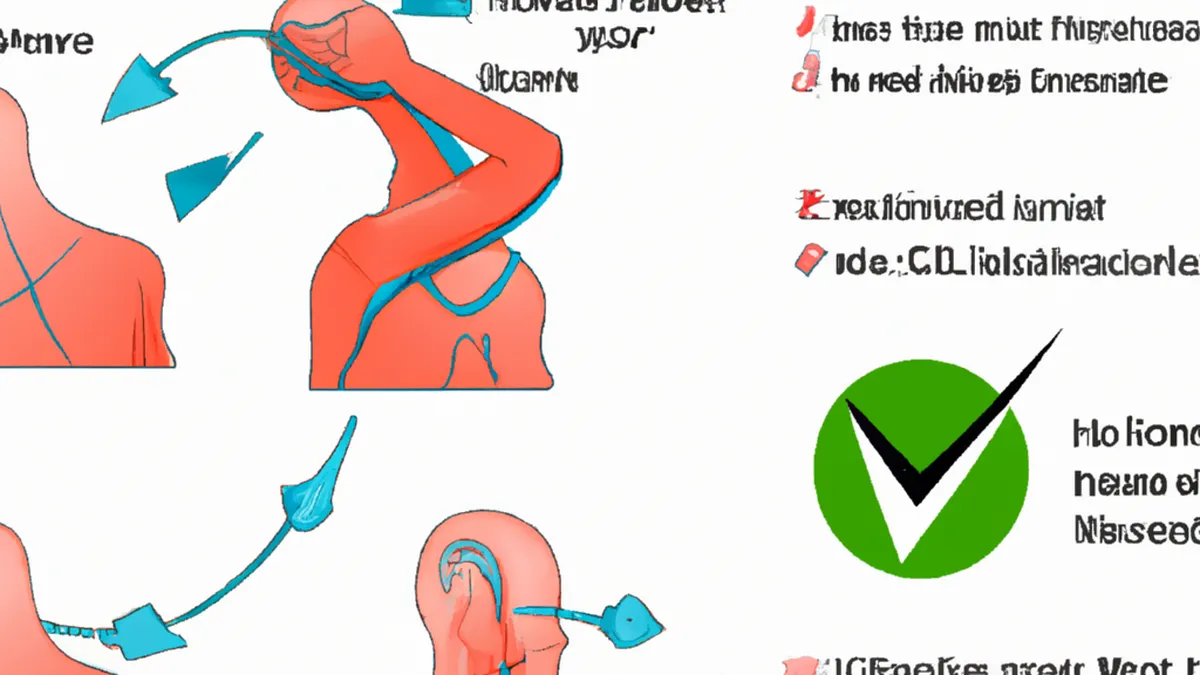
Convey Neck Pain Concepts Through Infographics
How to Create Infographics for Educating Others About Neck Pain
Infographics serve as effective visual communication tools. They simplify complex information, making it easy for a wide audience to understand. Infographics can convey vital information about neck pain, including causes, symptoms, treatments, and preventive measures. To create an engaging infographic, plan, use creativity, and understand the subject matter. This blog post guides you in making informative infographics about neck pain.
Understanding Neck Pain
Before designing, understand neck pain thoroughly. Millions of people experience neck pain from various causes, like poor posture, muscle strain, injuries, and medical conditions such as herniated discs and arthritis. Knowing these causes is essential for informing your infographic. Also, recognize symptoms like stiffness, discomfort, severe pain, and headaches to help your audience.
Research reputable medical sources or consult healthcare professionals for accurate information. This knowledge enriches your infographic and boosts your credibility as an educator.
Choosing the Right Tools
Many online tools help you create attractive infographics. Platforms like Canva, Piktochart, and Venngage offer user-friendly interfaces and diverse templates that simplify design. Choose tools based on your comfort level with design software and your specific needs.
1. **Select a Template:** Begin with a template that matches your theme. Look for flexible designs that allow you to include all necessary information without feeling cramped.
2. **Incorporate Visuals:** Use icons, images, and charts to represent neck pain and its effects. Visuals should complement your text and enhance understanding. For instance, anatomical diagrams can illustrate common neck pain locations.
3. **Use Color Wisely:** Choose a color scheme that is appealing yet not overwhelming. Soft blues and greens can convey calmness, while bolder colors can highlight critical points.
Organizing Your Content
After selecting tools, organize your content effectively. A well-structured infographic guides the reader logically. Outline key points to cover, and refine them for clarity and conciseness.
Key Components to Include
1. **Causes of Neck Pain:** Clearly outline common causes using bullet points for easy reading. Include factors like poor ergonomics, stress, and sleeping positions. Icons can visually represent each cause.
2. **Symptoms:** Dedicate a section to symptoms. This helps readers identify if they experience neck pain. Use checklists or visual indicators for engagement and clarity.
3. **Treatment Options:** Offer…
Conclusion
Summarize the insights shared in this post.
Below are related products based on this post:
FAQ
What are the common causes of neck pain that should be included in an infographic?
Common causes of neck pain include poor posture, muscle strain, injuries, and medical conditions such as herniated discs and arthritis. It’s important to outline these factors clearly in your infographic to educate your audience effectively.
Which tools are recommended for creating infographics about neck pain?
Recommended tools for creating infographics include Canva, Piktochart, and Venngage. These platforms provide user-friendly interfaces and a variety of templates that can help you design engaging and informative graphics.
What key components should be included in an infographic about neck pain?
An effective infographic about neck pain should include sections on the causes of neck pain, symptoms to help readers identify their condition, and treatment options. Organizing these components clearly will enhance understanding and engagement.


Post Comment